When lockdown rules are relaxed it will be interesting to see if shopper’s return in the numbers we saw before the Covid-19 breakout. A large factor in this will be consumer’s confidence in stores to enforce social distancing and therefore retailers will be keen to measure performance in this new KPI. Offices and warehouses may also be thinking along the same lines. With footfall cameras and other IoT feeding data to Qlik Sense it’s possible to build a customer tracker and even an alert system. Here’s how…
I’ll break this down into the following steps:
- Convert spatial data into geo-coordinates for Qlik Sense
- Whitelist your floor plan URL and display it in a map object
- Display customer’s positions on the floorplan
- Create a heatmap version
- Calculate distances in the script using Pythagorean theorem
- Use distances to create a colour coded version of the customer map
- Setting up alerts
- Analysing the data
Convert spatial data into geo-coordinates for Qlik Sense
For your business app you’ll be connecting to spatial data from footfall cameras and other sensors but for this example we’ll create some data using an Inline load. As you’ll see below, you’ll need a unique identifier for each customer/person and some X and Y coordinates (latitude and longitude coordinates will also work). The below coordinates are in meters and relate to their position on the shop floor.
The data is loaded into a table called Temp because we actually want to load the table again and this time create the Geo Point coordinates (a single field containing both the X and Y positions) using the function GeoMakePoint. Having loaded this data into a table called customers we no longer need the Temp table so it has been dropped.
Whitelist your floor plan URL and display it in a map object
Now we can start work on the front end (UI) of the app.
In a blank sheet, drag a map object onto the sheet. You’ll be presented with the default world map however, in this case we want to use our own map. To do this, we’ll first need to get rid of the world map. In the map object chart properties (right hand side of the screen) open up the Map Settings and change the base map from Default to None. This will present a blank space for you to add your floor map. Below the base map setting, change the Projection from Mercator to User Defined (Meters)
It’s now time to add the floor map, which we’ll do by creating a background layer. In the map object properties click on Layers then Add Layer. Select the Background Layer. If you have a TMS or WMS map hosted somewhere you can use these but for this example we’ll be using a floormap imageso select Image under Format. The image needs to be hosted somewhere (for testing purposes you can google a floor plan and use its IRL). In the URL box enter your URL. PLEASE NOTE: the image will only work if the URL has been whitelisted. You can do this in the QMC, or if you’re using Qlik’s own cloud version, in the Administration area.
You should now have a floor plan displayed in your map object but the zoom or position may not be as you’d like it. To get the floor map into position, and so it can relate well to your coordinates data, you need to tell the map where the top left and bottom right corners should be positioned. Simply use the image’s pixel information for this and set the numbers in the Top (Latitude) and Right (Longitude) boxes.
Display customer’s positions on the floorplan
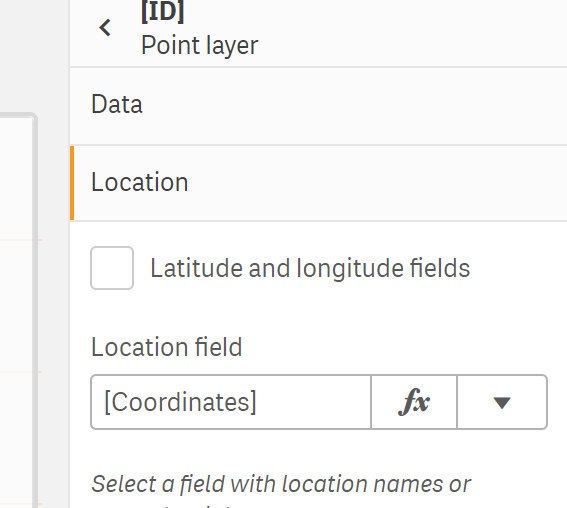
Add another layer and this time choose the Point Layer. The dimension should be your unique person ID and the location should be set to your Coordinates field as per the image to the right. Under Size & Shape you can change the colour size and shape of the dots that identify people on your map. You can even add an icon.
You should now have a floor map with customer’s positions displayed, something like below:
Create a heatmap version
You may prefer to display the data as heatmap. To do so, instead of adding a point layer, add a Density Layer. The dimension and locations should be set just as they were in the previous steps. You can the influence of each point using the Influence setting under Weight & Radius.
Calculate distances in the script using Pythagorean theorem
Both versions of the above maps will give you information on social distancing but only visually and not with any great level of accuracy because it’s up to the eyes and mind to guess the actual distances between people. It would be better to actually calculate the distances. To that we need to use something many of us have not used since school; Pythagorian Theorum.
In the above script you will see that we’ve reloaded our data into a new table called Dist1. The Qualify statement is used to ensure that autoconcatenation is not envoked. We want to know each customer/person’s position in relation to all other customers so we need compare the coordinates of every row in the table. The data is loaded again (into Dist2) and then joined back onto Dist1. As the data has been qualified it will not have a single field name in common and therefore a Cartesian product is created – i.e. each row of data in the first table is joined to every other row in the second table. We can now add the distance calculation (Pythagorian theorem) – see the above script.
Use distances to create a colour coded version of the customer map
We can use the calculated distances to colour code customers by adding another point layer and setting the colour properties via an IF formula. In my example I set the social distancing to 4 meters because it displays better for blogging purposes. I used the following formula:
=if(only(Distance)<=4,LightRed(),LightGreen())
As you can see below, the 2 customers breaking the social distacing limit are highlighted in red.
Setting Up Alerts
In some, stricter, circumstances you may want to set up an alert when people are not social distancing. There are a couple of ways to do this but to write out all the steps would be another blog post. So in summary… The first is to utilise QLik’s new value added product Qlik Alerting. You can use this to set up calculations that look for any distance dropping under a given number and alert staff via e-mail or mobile notification. For more information visit https://www.qlik.com/us/products/qlik-alerting.
The other way to set up alerts is to use the SMTP connector in Web Connectors package. I highly recommend Steve Dark’s blog post on the subject as I’ve successfully used it a few times myself. https://www.quickintelligence.co.uk/send-data-from-qlik-load-script/
Analysing the Data
So now you’ve built an app… How should we interpret the data?
The rules on measuring success will differ from business to business so exceptions may need to come into play. A single parent may have to bring their child along to the shop with them, should they be flagged for not socially distancing? Without highly sophisticated IoT that can identify such a situation we’ll have to be adapt our measurements to take exceptions into account. Perhaps we can take an average distance between customers or track the data over time and set up alerts when social distancing limits are breached more than x times an hour. Most likely, businesses will look at a combination of these at the end of each day. If the average distance is decreasing over time and the number of breaches is increasing it will be a warning sign that an intervention is required; a one way system, clearer distance markers, etc.

Four days after your post this shows up 🙂
https://www.flerlagetwins.com/2020/05/floor-plan.html?m=1
LikeLike
Ha. I expect a cheque in the post.
LikeLike