I wanted to build an app for demo purposes that shows how you can conduct What If analysis in Qlik Sense, I just needed a theme…
It isn’t really that long ago since Jimmy Hill introduced the the 3 points for a win system to English football in 1981 in an effort to encourage attacking play and tackle the issue dwindling crowds. Big hitters like Germany, Spain, Brazil and Argentina didn’t introduce the system until as recently as 1995. Nowadays it’s hard to think that teams only got 2 points following victory. Some pundits have argued that it actually stifled attacking play; causing teams that went 1-0 ahead to “park the bus” and protect their precious points.
What difference did it make? Well, Blackburn’s famous Premier League victory in the 94/95 season wouldn’t have happened under the 2 points for a win system (Manchester United would have stolen it on goal difference) and in the 2010 World Cup minnows New Zealand would have qualified from their group to reach the knockouts.
With all this in mind I created a “Premier League Game Changer” app, allowing users to play with the rules and assess the impact. What If analysis for football.
Whether you’re a Manchester City fan wondering how a change in the rules might help you win the league by Christmas or a Crystal Palace fan searching for a way to make losses earn more points than a win so that you can see what it’s like to be at the top of the league, this is the app for you. However, because Qlik don’t currently offer a free public space for dashboards you’ll have to make do with this video below. Fear not though, following the video I will outline the key steps so that you can build your own.
How to Build the App
First of all we need some data. You can find many websites showing detailed version of the Premier League table, but I prefer sites like Soccerway and SportsMole, Simply highlight, copy and paste the table into Excel and then load into Qlik Sense. You can then replicate the original table in the front end/user interface (UI) of Qlik Sense – team as the dimension with the measures as sum(points) and sum(goal difference). If you include a column with the league position (1 to 20) then it will make things easier but even without that you can use the Rank() function on the number of points to derive league position.
I used the VizLib table extension for my Premier League table but you can use the out-of-the-box Qlik Sense table if you like.
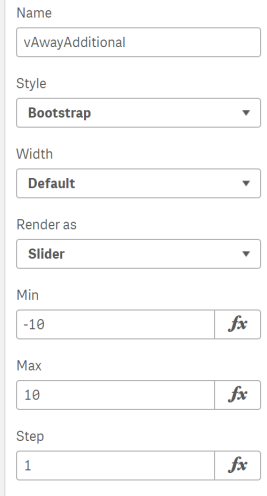
To create the new league table we can copy the original one and paste it. Before you start updating the calculations you need to provide end users with a way of inputting their new rules. I downloaded and installed an extension called qsVariable which provides buttons, selection boxes and sliders for your Qlik variables. In the extension settings name a new variable (e.g. vAwayAdditional which I use to assign extra points for an away win), choose a style and render as a slider. You should also define a min and max value for the variable (the range of points).
Create variable for the number of points for a win, draw, loss and for away win bonus points. Feel free to add your own new rules and a variable to control them.
Now we can create an expression that will calculate the new number of points, taking the user input into account. This expression will be the base for further expressions in the app so store this expression as a variable
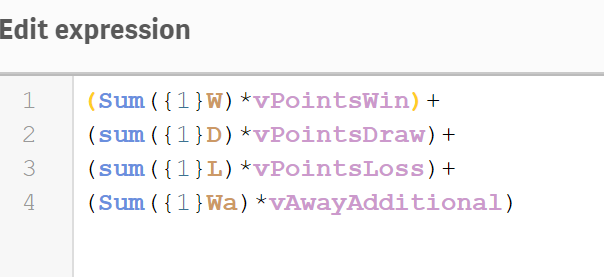
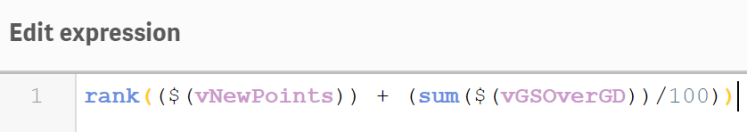
In the above expression W is the number of wins, D the number of draws and L the number of losses. Wa is the number of away wins. The expression results in the new number of points a team gets under the new rules. I named this variable vNewPoints. We can then reference it using dollar expansion in further expressions. The expression below results in the new league position. It takes the new number of points and adds to it the goal difference (or goals scored depending on user selection) divided by 100. This last step is required to split teams who are on the same number of points. The calculation is wrapped in a rank() function.
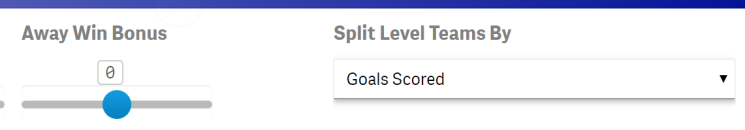
vGSOverGD was created very similarly to the other variables but this time we ask the qsVariable app to render it as a selection rather than a slider (see the top right of the app). Instead of setting a min and max you set alternatives for the variable – in this case ‘GD’ or ‘GS.’ GD being goal difference and GS being goals scored.
The next expression deducts the previous expression from the rank of each team in the original table.
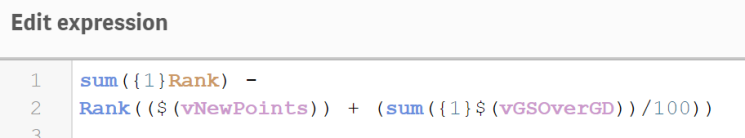
Throughout these expressions the set is defined as 1 ({1}) because I don’t want any accidental selections on team names to affect the results.
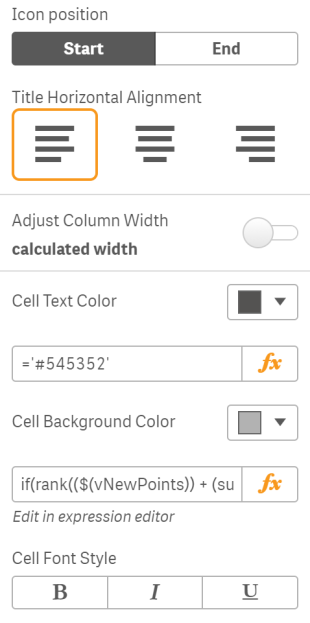
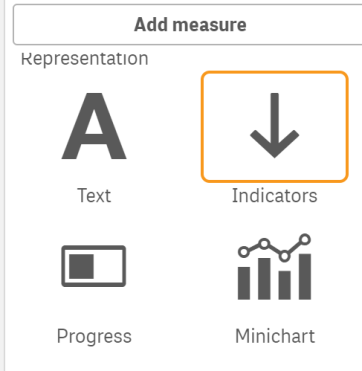
From here it’s mostly now a formatting job. I prefer the Vizlib table to the standard Qlik one because it has a lot more formatting options, including icons, and indicators. Play around with the layout, the look and feel.
And that’s it! You can add more rules and variables to make it as complex as you wish. If If I’ve missed out a step or you get stuck please leave a comment or e-mail me and I will be happy the help.
