A couple of weeks ago I was asked to create a quiz application with Qlik Sense. My company, Catalyst IT, had a sponsor’s stand at Thursday’s excellent Qlik Guru Day in London and we wanted to have something fun at our stand involving Qlik Sense (we also had a hololense displaying augmented reality, 3D interactive charts). We settled on a Star Wars theme and aimed to build a quiz which would work out if you were a Lightside or Darkside Qlik developer.
I love these kind of challenges; doing stuff with QlikView and Qlik Sense that it wasn’t designed for. It’s often when pushing the boundaries like this that you learn the most.
At first, though, I thought this would have been simple. Just load some questions, answers and scores (positive for Lightside and negative for Darkside) from a spreadsheet and have Qlik total up the scores from each question to give a total. That total would tell you which side you were on. I wanted to have a table cycle through the questions in order, only ever displaying one at a time. It turned out to not be so simple, for two reasons:
- Qlik Sense doesn’t have show/hide options like QlikView does
- Qlik’s associative power
In QlikView you had object show/hide options which I could have used to control which question was shown, either by having a text object for each question or by showing/hiding columns in a table. There’s no such option in Sense (yet) so I had to think outside the box. To add to my problems, Qlik’s associate engine meant that every time an answer was selected all the other questions became unavailable because they weren’t associated with eachother.
Download the data: SW_Qs
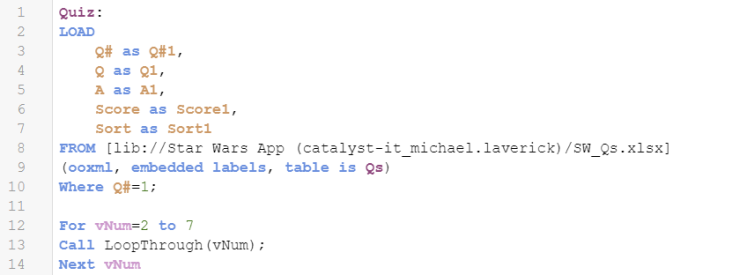
First I had to tackle the issue of data associaton. I’ve attached the data I was working with so you can try this yourself. The solution I came up with is described below but you might think of another way to tackle it. I wanted to keep the source data as simple as possible so that the format could be used for any other quiz in future, which meant the issues had to be addressed in the script:

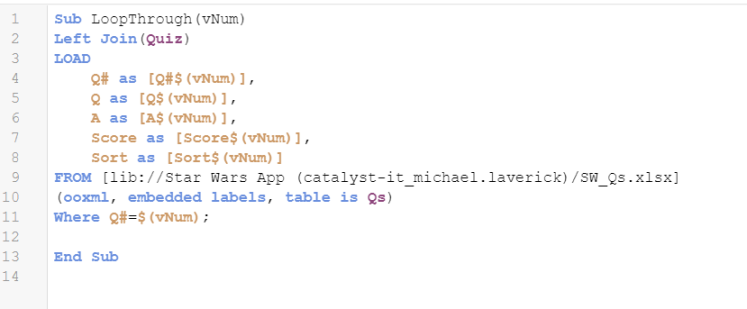
The subroutine called by the above script is displayed below:
This short but affective bit of script essentially creates the cartesian product of the questions and their answers. It loads each set of questions in turn (controlled by the vNum variable which increases by 1 each time it loops through the sub query) and joins it to each previous set of questions and answers. In doing so, every possible combination is accounted for so selecting an answer still leaves the questions that follow available to you. The join type in the script doesn’t really matter because when Qlik finds that no field names match it will automatically produce the cartesian product (one of those rare occasions in which such an outcome is desirable). Each question now had it’s own field which meant I could dynamically switch the questions in the front end (user interface) by using a variable as the dimension/measure name, all in one object.
In the app itself I used the Qlik KPI object on the front page to display the words “Enter the Quiz” and set the appearance options so that clicking on it would navigate to the next sheet. In that next sheet I set up another KPI object to display the current question and a table to display the possible answers. So that each object would only display one question at a time (and in order) I set up a variable called vQ with the following expression:![]()
This expression calculates the question number by taking the number of selections and adding 1*. A couple more variables are required that prefix the numeric result of vQ with either a Q (for question number) or an A (for answer number):

In the answers table object I added vA as the dimension which allows the table to toggle the field being displayed based on the number of selections. If you’ve downloaded the data and ran the above script you will notice that the result of vA and vQ will match the field names in the model.
With these variables in place all I needed to add to the KPI object was vQQ and in the table the dimension simply vA. I now had a fully dynamic sheet. All that was left was to find a way to get the results of the quiz to pop up. For that I needed show/hide objects that would appear based on a condition. In this case the condition was if the score was positive I wanted the Yoda image to appear. If it was negative then the Darth Vader image should appear. There are a couple of show/hide extensions on Qlik Branch but having a VizLib licence I knew I could use their tools to achieve what I wanted plus they would allow me to change the font size.
And that was it. Not too many steps but certainly more complex that I thought it would have been! Why not download the data and have a go at making your own? Let me know how you get on. Here are two of our Catalyst IT Apprentices, Ben and Myles, with their results!
——————————————————————————–
*When nothing has been selected the count of selections is zero. Add 1 to that and you get 1 i.e. Q1. Once a user has picked their first answer the count of selections is 1. Add 1 to that and you get Q2 and so forth.


